Plots#
In this lab, you will get familiar with the statistical features of Python using a famous dataset from the history of physics.
Instructions#
Create a folder named LASTNAME_FIRSTNAME_project_two, replacing LASTNAME and FIRSTNAME with your last name and first name, respectively.
Download the csv dataset below and place it in the new folder you created in step 1.
In the same folder, create a Microsoft Word docx document named project_two.docx.
In the same folder, create a Python py script named project_two.py
Read the Project section.
Answer the indicated questions in the Project section in the .docx document file.
When you are done, zip your folder and all its contents in a file named LASTNAME_FIRSTNAME_project_two.zip
Upload the zip file here: TODO
Background#
The Michelson Velocity of Light Experiment<https://www.gutenberg.org/files/11753/11753-h/11753-h.htm> conducted in 1887 remained one of most accurate estimations of the speed of light until modern times. Using a series of mirrors depicted below,
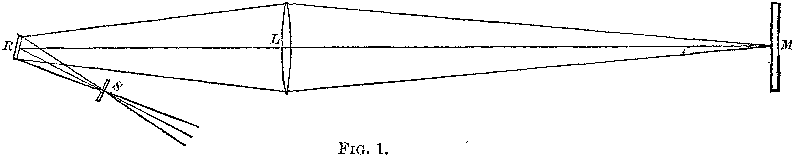
While the theoretical details of the experiment are interesting in their own right (see link above for further detail!), for this lab, we will take the data as given and analyze it from a statistical perspective.
Loading In Data#
The following code snippet will load in a CSV spreadsheet, parse it into a list and then print it to screen, assuming that file is saved in the same folder as your script.
import csv, os, sys

# discover file path of python script
#   i.e., if your python script is stored in C:\\myuser\Documents\projects\script.py
#           this command will return "C:\\myuser\Documents\project"
script_directory = os.path.dirname(os.path.abspath(sys.argv[0]))

# read in data
with open(f'{script_directory}/vietnam_draft_data.csv') as csv_file:
    csv_reader = csv.reader(csv_file)
    raw_data = [ row for row in csv_reader ]

# separate headers from data
headers = raw_data[0]
columns = raw_data[1:]

# grab first column from csv file
column_1 = [ float(row[0]) for row in columns ]

print(column_1)
Use this snippet to load in the provided data in order to finish the project.
Project#
Data Set#
You can download the full dataset here.
The following table is the a preview of the data you will be using for this project.
Velocity ( m/s ) |
299850 |
299740 |
299900 |
300070 |
299930 |
299850 |
299950 |
299980 |
299980 |
299880 |
300000 |
299980 |
299930 |
299650 |
299760 |
299810 |
300000 |
300000 |
299960 |
299960 |
299960 |
299940 |
299960 |
299940 |
299880 |
299800 |
299850 |
299880 |
299900 |
299840 |
299830 |
299790 |
299810 |
299880 |
299880 |
299830 |
299800 |
299790 |
299760 |
299800 |
299880 |
299880 |
299880 |
299860 |
299720 |
299720 |
299620 |
299860 |
299970 |
299950 |
299880 |
299910 |
299850 |
299870 |
299840 |
299840 |
299850 |
299840 |
299840 |
299840 |
299890 |
299810 |
299810 |
299820 |
299800 |
299770 |
299760 |
299740 |
299750 |
299760 |
299910 |
299920 |
299890 |
299860 |
299880 |
299720 |
299840 |
299850 |
299850 |
299780 |
299890 |
299840 |
299780 |
299810 |
299760 |
299810 |
299790 |
299810 |
299820 |
299850 |
299870 |
299870 |
299810 |
299740 |
299810 |
299940 |
299950 |
299800 |
299810 |
299870 |
The meaning of the columns is as follows.