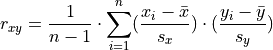
Correlation#
Correlation is a measure of the strength of a relationship that exists between two observable variables.
Introduction#
Preliminaries#
Before we can begin our study of correlation, let’s make some preliminary defintions that will help us keep everything clear and precise.
Univariate Statistics#
In order to differentiate between the statistics relationing to the x and y variables, we introduce some notation.
 and
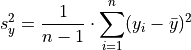
and  are defined as the univariate sample means of the
  and
and  variables. In other words, is the sample mean of the variable, as if we were observing the variable in isolation. Similarly for .
 and
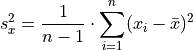
and  are defined as the univariate standard deviations of the and variables. In other words, is the standard deviation of the variable, as if we were observing the variable in isolation. Similarly, for .
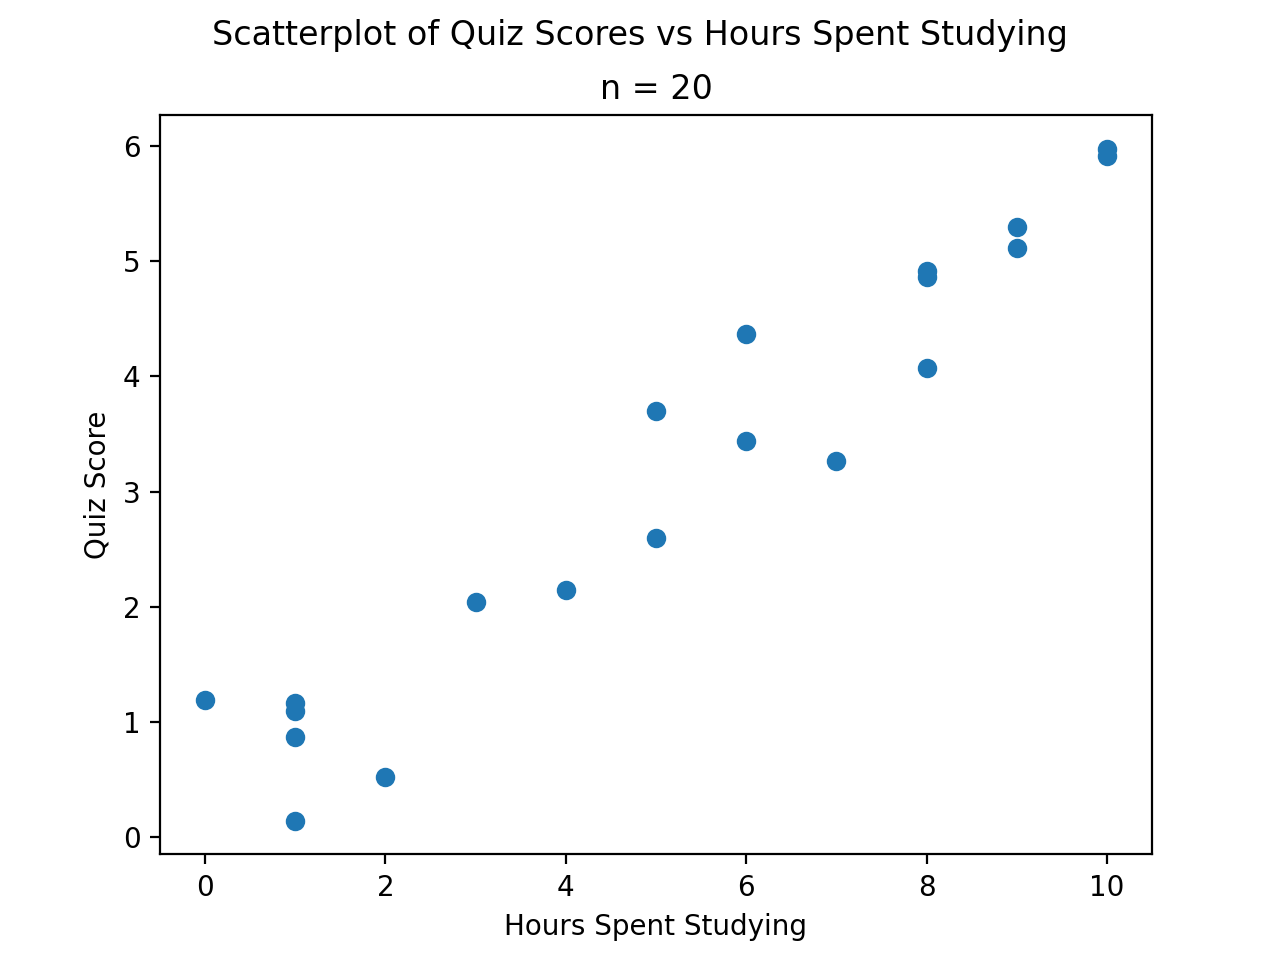
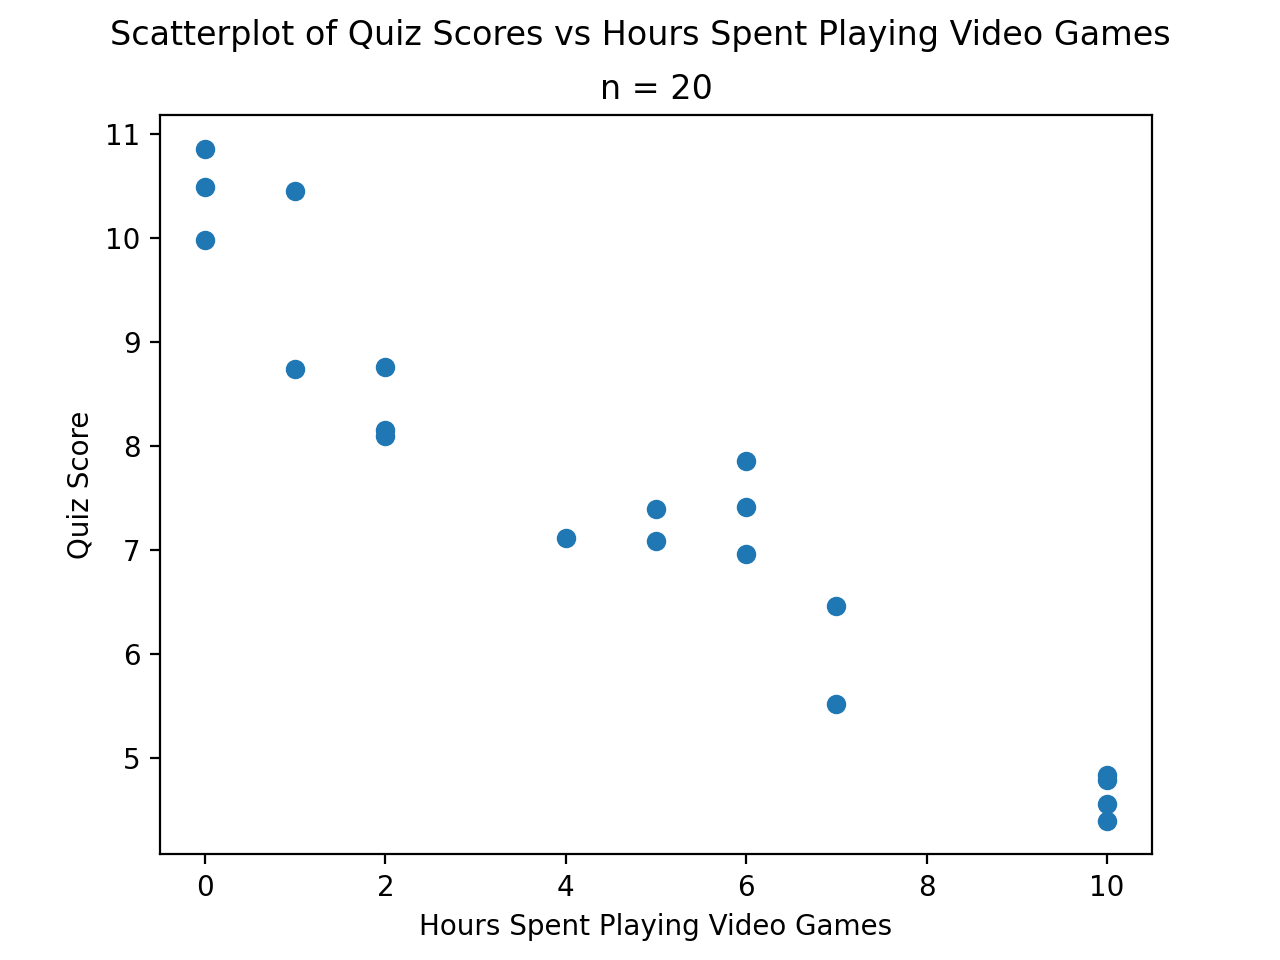
Assessing Correlation#
TODO
(Source code, png, hires.png, pdf)

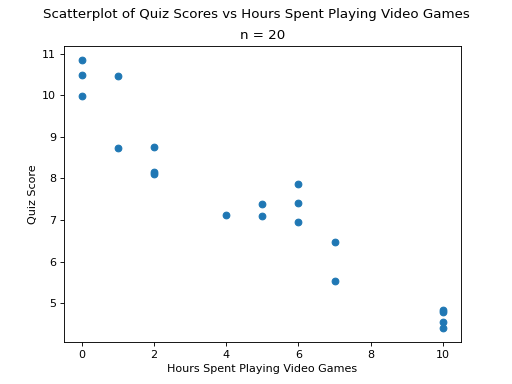
TODO
(Source code, png, hires.png, pdf)
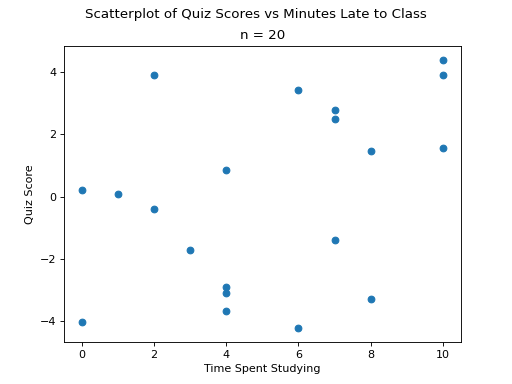
TODO
(Source code, png, hires.png, pdf)

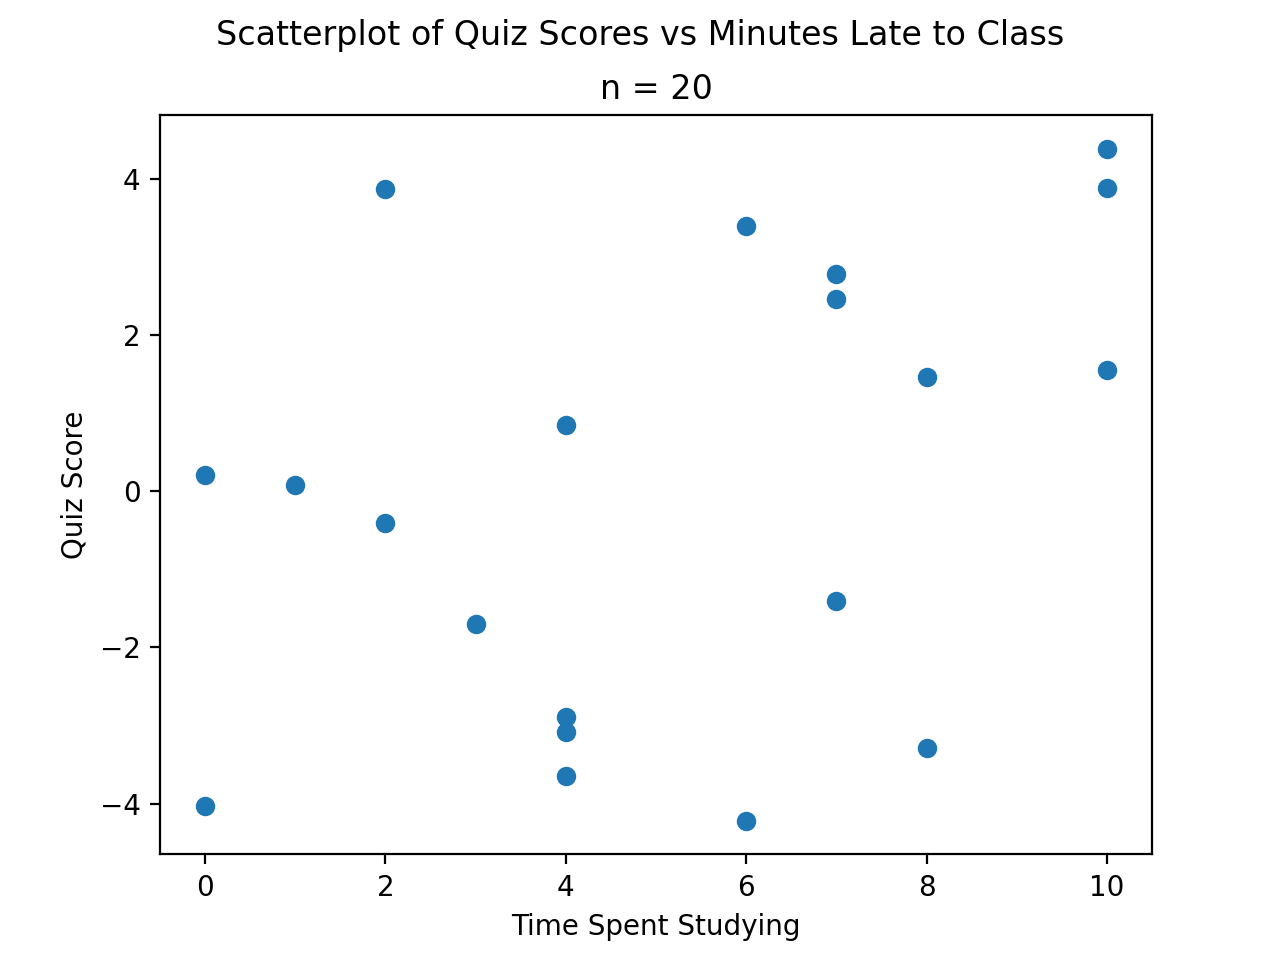
TODO
and are defined as the univariate standard deviations of the and variables. In other words, is the standard deviation of the variable, as if we were observing only alone. Similarly, for .
Definition#
Version 1#
TODO: justification. make some plots.
Version 2#
TODO: shortcut for version 2
Version 3#
TODO: justifcation, again.