Quarter One#
2021, Free Response, #1
The length of stay in a hospital after receiving a particular treatment is of interest to the patient, the hospital, and insurance providers. Of particular interest are unusually short or long lengths of stay. A random sample of 50 patients who received the treatment was selected, and the length of stay, in number of days, was recorded for each patient. The results are summarized in the following table and are shown in the dotplot.
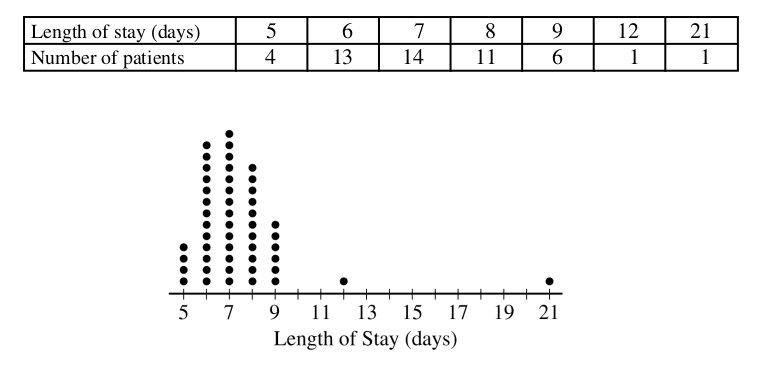
Determine the five-number summary of the distribution of length of stay.
Consider two rules for identifying outliers, method A and method B. Let method A represent the 1.5 x IQR rule, and let method B represent the 2 standard deviations rule.
Using method A, determine any data points that are potential outliers in the distribution of length of stay. Justify your answer.
The mean length of stay for the sample is 7.42 days with a standard deviation of 2.37 days. Using method B, determine any data points that are potential outliers in the distribution of length of stay. Justify your answer.
Explain why method A might identify more data points as potential outliers than method B for a distribution that is strongly skewed to the right.
2017, Free Response #4
The chemicals in clay used to make pottery can differ depending on the geographical region where the clay originated. Sometimes, archaeologists use a chemical analysis of clay to help identify where a piece of pottery originated. Such an analysis measures the amount of a chemical in the clay as a percent of the total weight of the piece of pottery. The boxplots below summarize analyses done for three chemicals—X, Y, and Z—on pieces of pottery that originated at one of three sites: I, II, or III.
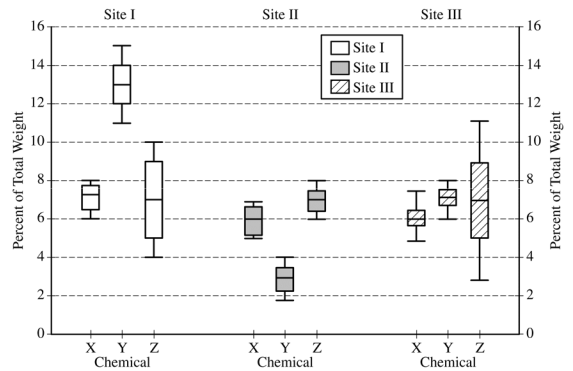
Use this information to answer the following questions.
For chemical Z, describe how the percents found in the pieces of pottery are similar and how they differ among the three sites.
Consider a piece of pottery known to have originated at one of the three sites, but the actual site is not known.
Suppose an analysis of the clay reveals that the sum of the percents of the three chemicals X, Y, and Z is 20.5%. Based on the boxplots, which site—I, II, or III—is the most likely site where the piece of pottery originated? Justify your choice.
Suppose only one chemical could be analyzed in the piece of pottery. Which chemical—X, Y, or Z— would be the most useful in identifying the site where the piece of pottery originated? Justify your choice.
2014, Free Response, #1
An administrator at a large university is interested in determining whether the residential status of a student is associated with level of participation in extracurricular activities. Residential status is categorized as on campus for students living in university housing and off campus otherwise. A simple random sample of 100 students in the university was taken, and each student was asked the following two questions.
Are you an on campus student or an off campus student?
In how many extracurricular activities do you participate?
The responses of the 100 students are summarized in the frequency table shown.
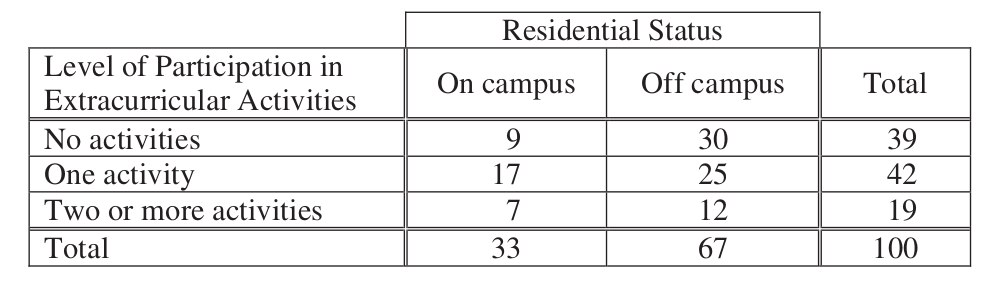
Calculate the proportion of on campus students in the sample who participate in at least one extracurricular activity and the proportion of off campus students in the sample who participate in at least one extracurricular activity.
On campus proportion:
Off campus proportion:
The responses of the 100 students are summarized in the segmented bar graph shown.
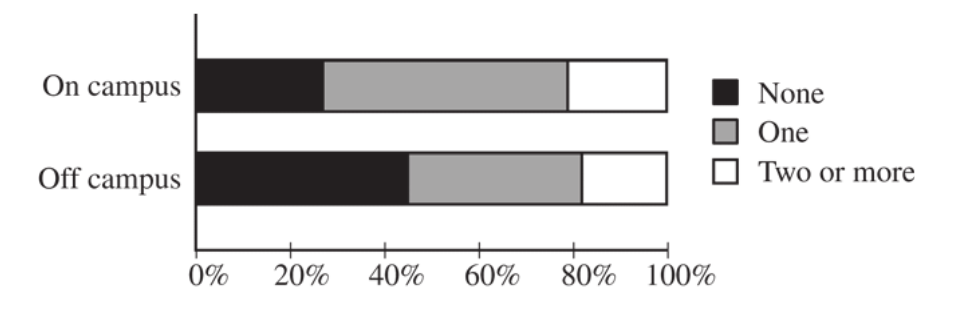
Write a few sentences summarizing what the graph reveals about the association between residential status and level of participation in extracurricular activities among the 100 students in the sample.
2011, Free Response, #1
A professional sports team evaluates potential players for a certain position based on two main characteristics, speed and strength.
Speed is measured by the time required to run a distance of 40 yards, with smaller times indicating more desirable (faster) speeds. From previous speed data for all players in this position, the times to run 40 yards have a mean of 4.60 seconds and a standard deviation of 0.15 seconds, with a minimum time of 4.40 seconds, as shown in the table below.
Mean |
Standard Deviation |
Minimum |
|
Time to run 40 yards |
4.60 s |
0.15 seconds |
4.40 s |
Based on the relationship between the mean, standard deviation, and minimum time, is it reasonable to believe that the distribution of 40-yard running times is approximately normal? Explain.
Hint
Think about the Empirical Rule!
Strength is measured by the amount of weight lifted, with more weight indicating more desirable (greater) strength. From previous strength data for all players in this position, the amount of weight lifted has a mean of 310 pounds and a standard deviation of 25 pounds, as shown in the table below.
Mean |
Standard Deviation |
|
Amount of weight lifted |
310 lb |
25 lb |
Calculate and interpret the z-score for a player in this position who can lift a weight of 370 pounds.
The characteristics of speed and strength are considered to be of equal importance to the team in selecting a player for the position. Based on the information about the means and standard deviations of the speed and strength data for all players and the measurements listed in the table below for Players A and B, which player should the team select if the team can only select one of the two players? Justify your answer.
Player A |
Player B |
|
Time to run 40 yards |
4.42 seconds |
4.57 seconds |
Amount of weight lifted |
370 pounds |
375 pounds |
2019, Free Response, #5
A company that manufactures smartphones developed a new battery that has a longer life span than that of a traditional battery. From the date of purchase of a smartphone, the distribution of the life span of the new battery is approximately normal with mean 30 months and standard deviation 8 months. For the price of $50, the company offers a two-year warranty on the new battery for customers who purchase a smartphone. The warranty guarantees that the smartphone will be replaced at no cost to the customer if the battery no longer works within 24 months from the date of purchase.
In how many months from the date of purchase is it expected that 25 percent of the batteries will no longer work? Justify your answer.
Suppose one customer who purchases the warranty is selected at random. What is the probability that the customer selected will require a replacement within 24 months from the date of purchase because the battery no longer works?