Regression Model#
2016, Free Response, #6
A newspaper in Germany reported that the more semesters needed to complete an academic program at the university, the greater the starting salary in the first year of a job. The report was based on a study that used a random sample of 24 people who had recently completed an academic program. Information was collected on the number of semesters each person in the sample needed to complete the program and the starting salary, in thousands of euros, for the first year of a job. The data are shown in the scatterplot below.
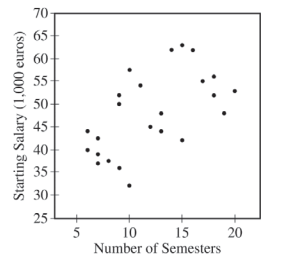
Does the scatterplot support the newspaper report about number of semesters and starting salary? Justify your answer.
The table below shows computer output from a linear regression analysis on the data.
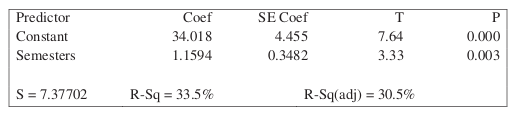
Identify the slope of the least-squares regression line, and interpret the slope in context.
An independent researcher received the data from the newspaper and conducted a new analysis by separating the data into three groups based on the major of each person. A revised scatterplot identifying the major of each person is shown below.
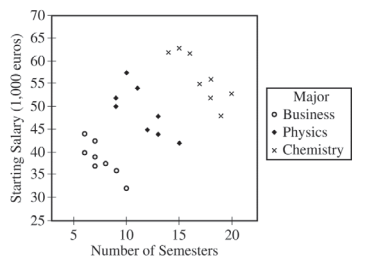
Based on the people in the sample, describe the association between starting salary and number of semesters for the business majors.
Based on the people in the sample, compare the median starting salaries for the three majors.
Based on the analysis conducted by the independent researcher, how could the newspaper report be modified to give a better description of the relationship between the number of semesters and the starting salary for the people in the sample?
2011, Free Response, #5
Windmills generate electricity by transferring energy from wind to a turbine. A study was conducted to examine the relationship between wind velocity in miles per hour (mph) and electricity production in amperes for one particular windmill. For the windmill, measurements were taken on twenty-five randomly selected days, and the computer output for the regression analysis for predicting electricity production based on wind velocity is given below. The regression model assumptions were checked and determined to be reasonable over the interval of wind speeds represented in the data, which were from 10 miles per hour to 40 miles per hour.
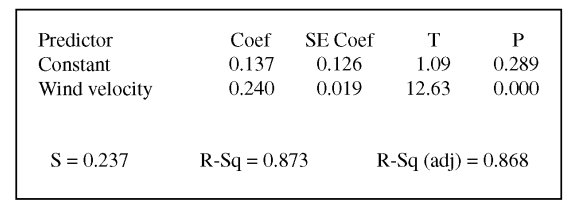
Use the computer output above to determine the equation of the least squares regression line. Identify all variables used in the equation.
How much more electricity would the windmill be expected to produce on a day when the wind velocity is 25 mph than on a day when the wind velocity is 15 mph? Show how you arrived at your answer.
What proportion of the variation in electricity production is explained by its linear relationship with wind velocity?
Is there statistically convincing evidence that electricity production by the windmill is related to wind velocity? Explain.
2022, Free Response, #1
A biologist gathered data on the length, in millimeters (mm), and the mass, in grams (g) , for 11 bullfrogs. The data are shown in Plot 1.
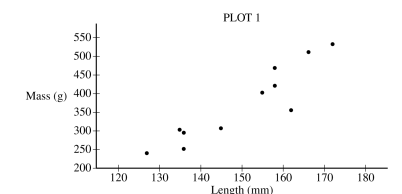
Based on the scatterplot, describe the relationship between mass and length, in context.
From the data, the biologist calculated the least-squares regression line for predicting mass from length. The least-squares regression line is shown in Plot 2 .
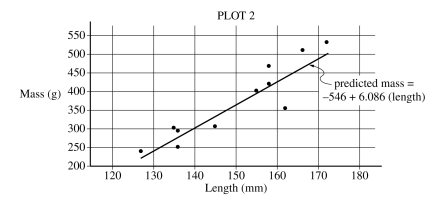
Identify and interpret the slope of the least-squares regression line in context.
Interpret the coefficient of determination of the least-squares regression line,
 , in context.
From Plot 2 , consider the residuals of the 11 bullfrogs.
Based on the plot, approximately what is the length and mass of the bullfrog with the largest absolute value residual?
Does the least-squares regression line overestimate or underestimate the mass of the bullfrog identified in part d-i? Explain your answer.
2018, Free Response, #1
The manager of a grocery store selected a random sample of 11 customers to investigate the relationship between the number of customers in a checkout line and the time to finish checkout. As soon as the selected customer entered the end of a checkout line, data were collected on the number of customers in line who were in front of the selected customer and the time, in seconds, until the selected customer was finished with the checkout. The data are shown in the following scatterplot along with the corresponding least-squares regression line and computer output.
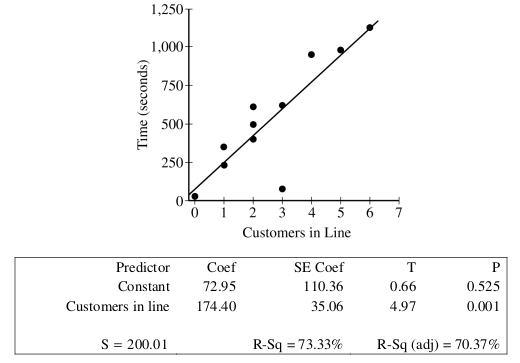
Identify and interpret in context the estimate of the intercept for the least-squares regression line.
Identify and interpret in context the coefficient of determination,
 .
.One of the data points was determined to be an outlier. Circle the point on the scatterplot and explain why the point is considered an outlier.
2017, Free Response, #1
Researchers studying a pack of gray wolves in North America collected data on the length x, in meters, from nose to tip of tail, and the weight y, in kilograms, of the wolves. A scatterplot of weight versus length revealed a relationship between the two variables described as positive, linear, and strong.
For the situation described above, explain what is meant by each of the following words.
Positive:
Linear:
Strong:
The data collected from the wolves were used to create the least-squares equation
 . Interpret the meaning of the slope of the least-squares regression line in context.
One wolf in the pack with a length of
 meters had a residual of
  kilograms. What was the weight of the wolf?