Normal Distribution#
Introduction#
Standard Normal#
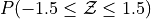
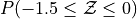
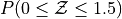
Sketch a Standard Normal distribution in the x-y plane. Shade in the areas indicated in the problems below. Label the axes. Label each area with the percentage of the distribution that corresponds to the shaded region. Use a Z Table to find the exact percentage.


What is the relationship between parts a and b, and parts c and d? What characteristic of the Standard Normal distribution is being shown here?


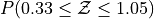
Sketch a Standard Normal distribution in the x-y plane. Shade in the areas indicated in the problems below. Label the axes. Label each area with the percentage of the distribution that corresponds to the shaded region. Use a Z Table to find the exact percentage.
What is the relationship between parts a, b and c? Explain the result graphically.
Sketch a Standard Normal distribution in the x-y plane. Find the values of Z which correspond to the areas given below. Shade in the areas and label the axes with the value found. Use a Z Table to solve the problem.
0.90
0.75
0.5
0.25
0.10
The Empirical Rule
Since the Z-Table is the cumulative distribution function for the Standard Normal distribution, The Empirical Rule can be derived through a Z-table. Recall the Empirical Rule states,
This can be stated more precisely in terms of the Z distributions as follows,
The Empirical Rule is an approximation, meant for quick calculations. It is not exact, as you will soon discover.
Non-standard Normal#
TODO
A.P. Exam Practice#
TODO: need to find normal only (i.e. no central limit theorem or random variable linear combinations)