Population Mean#
2009, Free Response Form B, #5
A bottle-filling machine is set to dispense 12.1 fluid ounces into juice bottles. To ensure that the machine is filling accurately, every hour a worker randomly selects four bottles filled by the machine during the past hour and measures the contents. If there is convincing evidence that the mean amount of juice dispensed is different from 12.1 ounces or if there is convincing evidence that the standard deviation is greater than 0.05 ounce, the machine is shut down for recalibration. It can be assumed that the amount of juice that is dispensed into bottles is normally distributed.
During one hour, the mean number of fluid ounces of four randomly selected bottles was 12.05 and the standard deviation was 0.085 ounce.
Perform a test of significance to determine whether the mean amount of juice dispensed is different from 12.1 fluid ounces. Assume the conditions for inference are met.
To determine whether this sample of four bottles provides convincing evidence that the standard deviation of the amount of juice dispensed is greater than 0.05 ounce, a simulation study was performed. In the simulation study, 300 samples, each of size 4, were randomly generated from a normal population with a mean of 12.1 and a standard deviation of 0.05. The sample standard deviation was computed for each of the 300 samples. The dotplot below displays the values of the sample standard deviations.
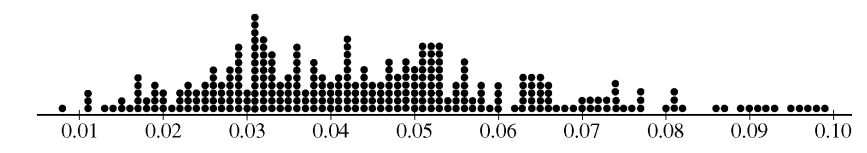
Use this information to answer the following question.
Use the results of this simulation study to explain why you think the sample provides or does not provide
evidence that the standard deviation of the juice dispensed exceeds 0.05 fluid ounce.
2006, Free Response Form B, #4
The developers of a training program designed to improve manual dexterity claim that people who complete the 6-week program will increase their manual dexterity. A random sample of 12 people enrolled in the training program was selected. A measure of each person’s dexterity on a scale from 1 (lowest) to 9 (highest) was recorded just before the start of and just after the completion of the 6-week program. The data are shown in the table below.
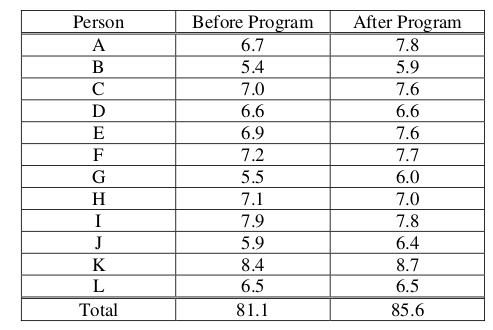
Can one conclude that the mean manual dexterity for people who have completed the 6-week training program has significantly increased? Support your conclusion with appropriate statistical evidence.
2007, Free Response, #4
Investigators at the U.S. Department of Agriculture wished to compare methods of determining the level of E. coli bacteria contamination in beef. Two different methods (A and B) of determining the level of contamination were used on each of ten randomly selected specimens of a certain type of beef. The data obtained, in millimicrobes/liter of ground beef, for each of the methods are shown in the table below.
Specimen |
1 |
2 |
3 |
4 |
5 |
6 |
7 |
8 |
9 |
10 |
Method A |
22.7 |
23.6 |
24.0 |
27.1 |
27.4 |
27.8 |
34.4 |
35.2 |
40.4 |
|
Method B |
23.0 |
23.1 |
23.7 |
26.5 |
26.6 |
27.1 |
33.2 |
35.0 |
40.5 |
47.8 |
Is there a significant difference in the mean amount of E. coli bacteria detected by the two methods for this type of beef? Provide a statistical justification to support your answer.
2011, Free Response, #4
High cholesterol levels in people can be reduced by exercise, diet, and medication. Twenty middle-aged males with cholesterol readings between 220 and 240 milligrams per deciliter (mg/dL) of blood were randomly selected from the population of such male patients at a large local hospital. Ten of the 20 males were randomly assigned to group A, advised on appropriate exercise and diet, and also received a placebo. The other 10 males were assigned to group B, received the same advice on appropriate exercise and diet, but received a drug intended to reduce cholesterol instead of a placebo. After three months, posttreatment cholesterol readings were taken for all 20 males and compared to pretreatment cholesterol readings. The tables below give the reduction in cholesterol level (pretreatment reading minus posttreatment reading) for each male in the study.
Do the data provide convincing evidence, at the  level, that the cholesterol drug is effective in producing a reduction in mean cholesterol level beyond that produced by exercise and diet?
2018, Free Response, #4
The anterior cruciate ligament (ACL) is one of the ligaments that help stabilize the knee. Surgery is often recommended if the ACL is completely torn, and recovery time from the surgery can be lengthy. A medical center developed a new surgical procedure designed to reduce the average recovery time from the surgery. To test the effectiveness of the new procedure, a study was conducted in which 210 patients needing surgery to repair a torn ACL were randomly assigned to receive either the standard procedure or the new procedure.
Based on the design of the study, would a statistically significant result allow the medical center to conclude that the new procedure causes a reduction in recovery time compared to the standard procedure, for patients similar to those in the study? Explain your answer.
Type of Procedure |
Sample Size |
Mean Recovery Time (Days) |
Standard Deviation Recovery Time (Days) |
Standard |
110 |
217 |
34 |
New |
100 |
186 |
29 |
Use this table to answer the following question.
Summary statistics on the recovery times from the surgery are shown in the above table. Do the data provide convincing statistical evidence that those who receive the new procedure will have less recovery time from the surgery, on average, than those who receive the standard procedure, for patients similar to those in the study?
2018, Free Response, #6
Systolic blood pressure is the amount of pressure that blood exerts on blood vessels while the heart is beating. The mean systolic blood pressure for people in the United States is reported to be 122 millimeters of mercury (mmHg) with a standard deviation of 15 mmHg.
The wellness department of a large corporation is investigating whether the mean systolic blood pressure of its employees is greater than the reported national mean. A random sample of 100 employees will be selected, the systolic blood pressure of each employee in the sample will be measured, and the sample mean will be calculated.
Let  represent the mean systolic blood pressure of all employees at the corporation. Consider the following hypotheses.


Use these hypotheses to answer the following questions.
Describe a Type II error in the context of the hypothesis test.
Assume that
, the standard deviation of the systolic blood pressure of all employees at the corporation, is 15 mmHg. If
, the sampling distribution of
for samples of size 100 is approximately normal with a mean of 122 mmHg and a standard deviation of 1.5 mmHg. What values of the sample mean
?
The actual mean systolic blood pressure of all employees at the corporation is 125 mmHg, not the hypothesized value of 122 mmHg, and the standard deviation is 15 mmHg.
Using the actual mean of 125 mmHg and the results from part b, determine the probability that the null
hypothesis will be rejected.
What statistical term is used for the probability found in part c?
Suppose the size of the sample of employees to be selected is greater than 100. Would the probability of rejecting the null hypothesis be greater than, less than, or equal to the probability calculated in part c? Explain your reasoning.
2007, Free Response Form B, #5
A serum cholesterol level above 250 milligrams per deciliter (mg/dl) of blood is a risk factor for cardiovascular disease in humans. At a medical center in St. Louis, a study to test the effectiveness of a new cholesterol-lowering drug was conducted. One hundred people with cholesterol levels between 250 mg/dl and 300 mg/dl were available for this study. Fifty people were assigned at random to each of two treatment groups. One group received the standard cholesterol-lowering medication and the other group received the new drug. After taking the drug for three weeks, the 50 subjects who received the standard treatment had a mean decrease in cholesterol level of 10 mg/dl with a standard deviation of 8 mg/dl, and the 50 subjects who received the new drug had a mean decrease of 18 mg/dl with a standard deviation of 12 mg/dl.
Does the new drug appear to be more effective than the standard treatment in lowering mean cholesterol level? Give appropriate statistical evidence to support your conclusion.