Correlation#
Up to now we have been dealing with univariate data. In this section, we begin the study of bivariate data.
Definitions#
Bivariate Data#

When two variables are measured on one individual, we call such data bivariate.
The  variable is sometimes called the independent or predictor variable. The
  variable is sometimes called the dependent or response variable. It is important to understand this terminology is only used in the context of the Linear Regression model introduced in the next section. Before the statistical significance of the relationship is established, this terminology is misleading, as it implies a relationship between the and y variable when none may exist. Correlation can be measured between variables that have no relationship whatsoever; in such instance we call the variables uncorrelated.
Important
Because we are dealing with randomness, uncorrelated variables will not necessarily have a correlation of 0. In fact, correlations of 0 are never observed in practice. There will always be a non-zero correlation between any given variables; the task of statistics is to determine whether or not this correlation is significant enough to use the outcome of one variable to make predictions about the outcome of the other variable.
Correlation#
Correlation is a measure of the strength of a relationship that exists between two observable variables. Before we can begin our study of correlation, let’s make some preliminary defintions that will help us keep everything clear and precise.
Univariate Statistics#
In order to differentiate between the statistics relationing to the x and y variables, we introduce some notation.
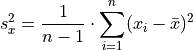
 and
and  are defined as the univariate sample means of the and variables. In other words, is the sample mean of the variable, as if we were observing the variable in isolation. Similarly for .
 and
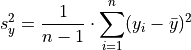
and  are defined as the univariate standard deviations of the and variables. In other words, is the standard deviation of the variable, as if we were observing the variable in isolation. Similarly, for .
TODO
and are defined as the univariate standard deviations of the and variables. In other words, is the standard deviation of the variable, as if we were observing only alone. Similarly, for .
TODO
Definition#
TODO
TODO: justification. make some plots.
Scatter Plots#
A scatterplot is a very simple and easy to understand graphical representation of bivariate data. The variable is plotted on the horizontal axis versus the variable on the vertical axis. Graphs of scatterplots are classified based on the direction of the relationship observed, the strength of the relationship observed and the linearity of the relationship observed.
Direction#
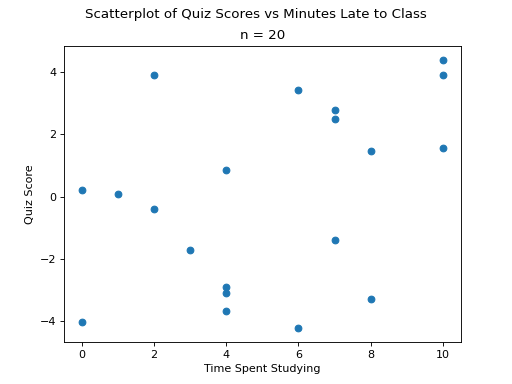
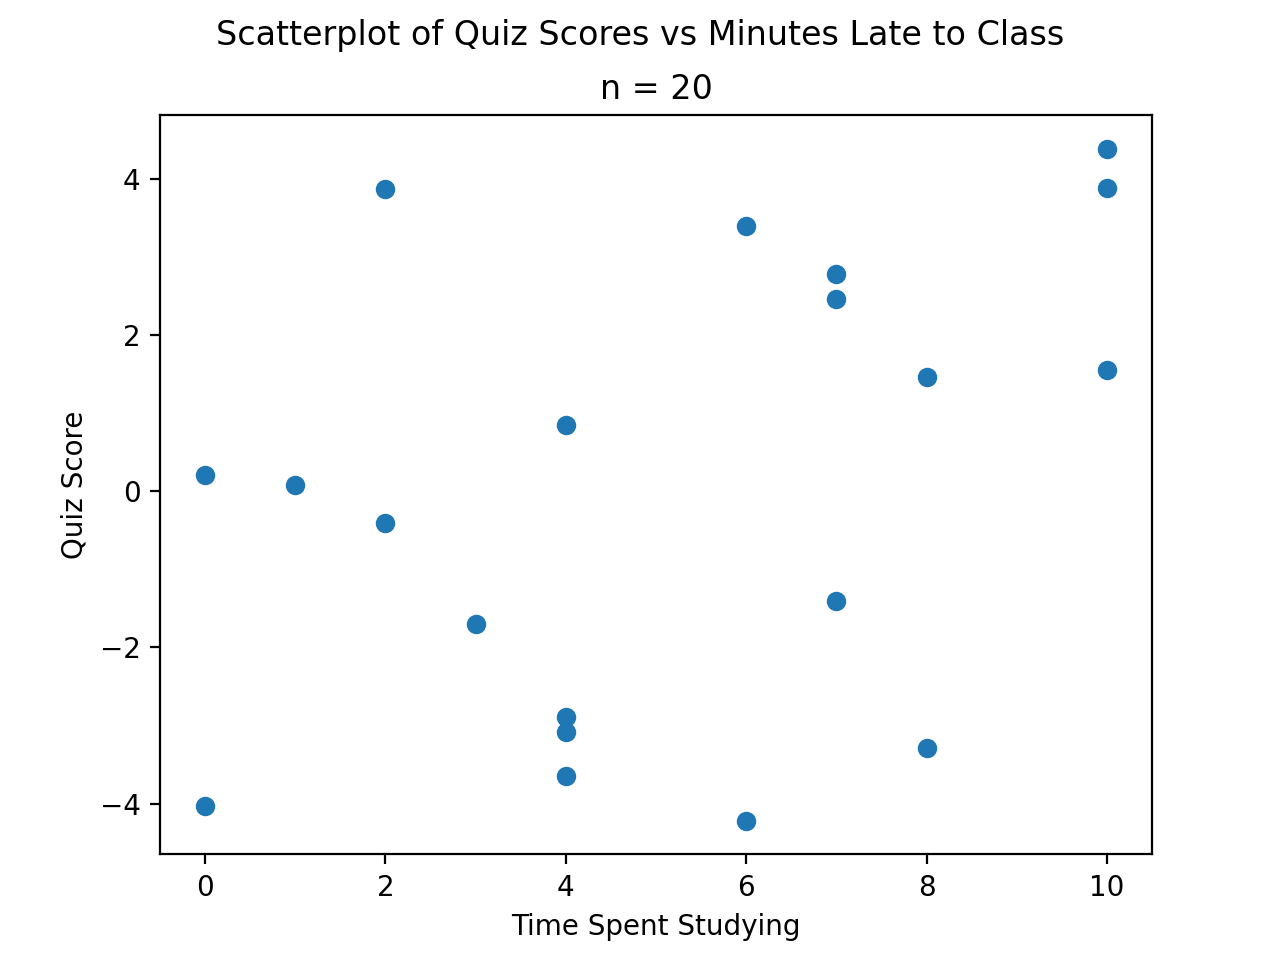
No Correlation#
A scatterplot with no correlation between the and variables should appear random,
(Source code, png, hires.png, pdf)

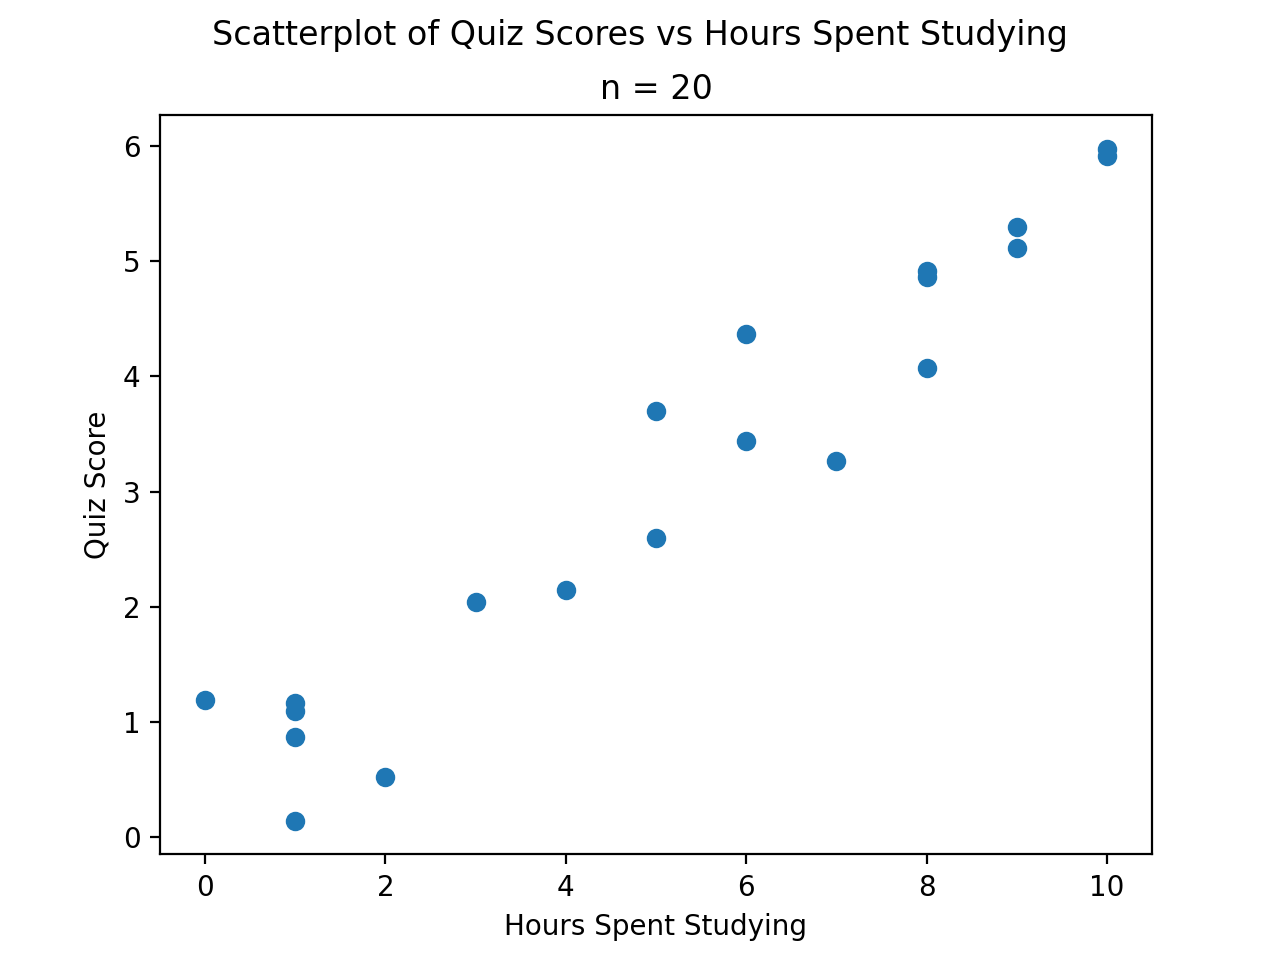
Positive Correlation#
A scatterplot with a positive correlation betwen the and variables should have a general upward trend,
(Source code, png, hires.png, pdf)

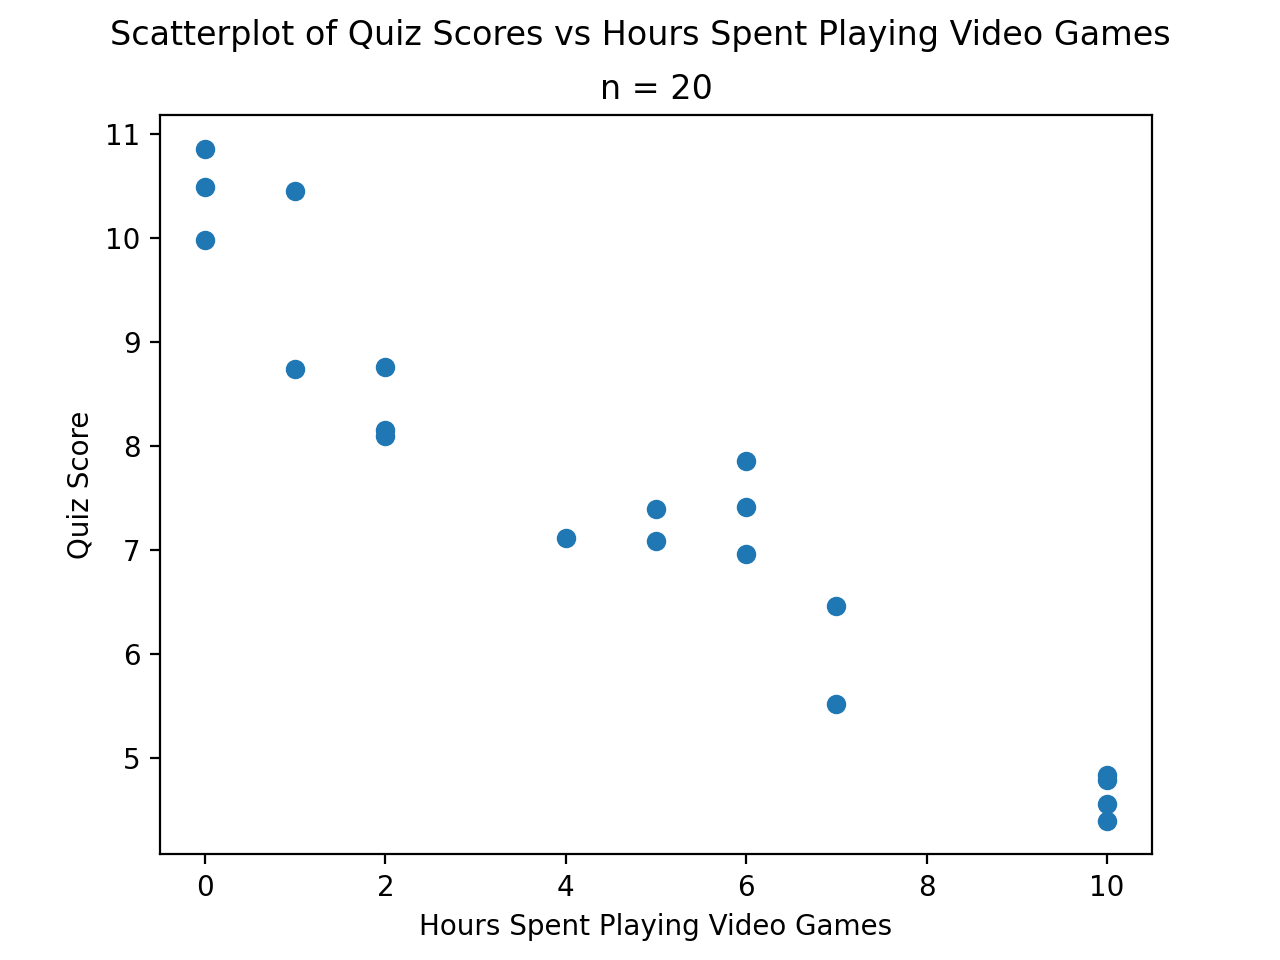
Negative Correlation#
(Source code, png, hires.png, pdf)
Strength#
Strong#
TODO
Weak#
TODO
Linearity#
Linear#
TODO
Non-Linear#
TODO
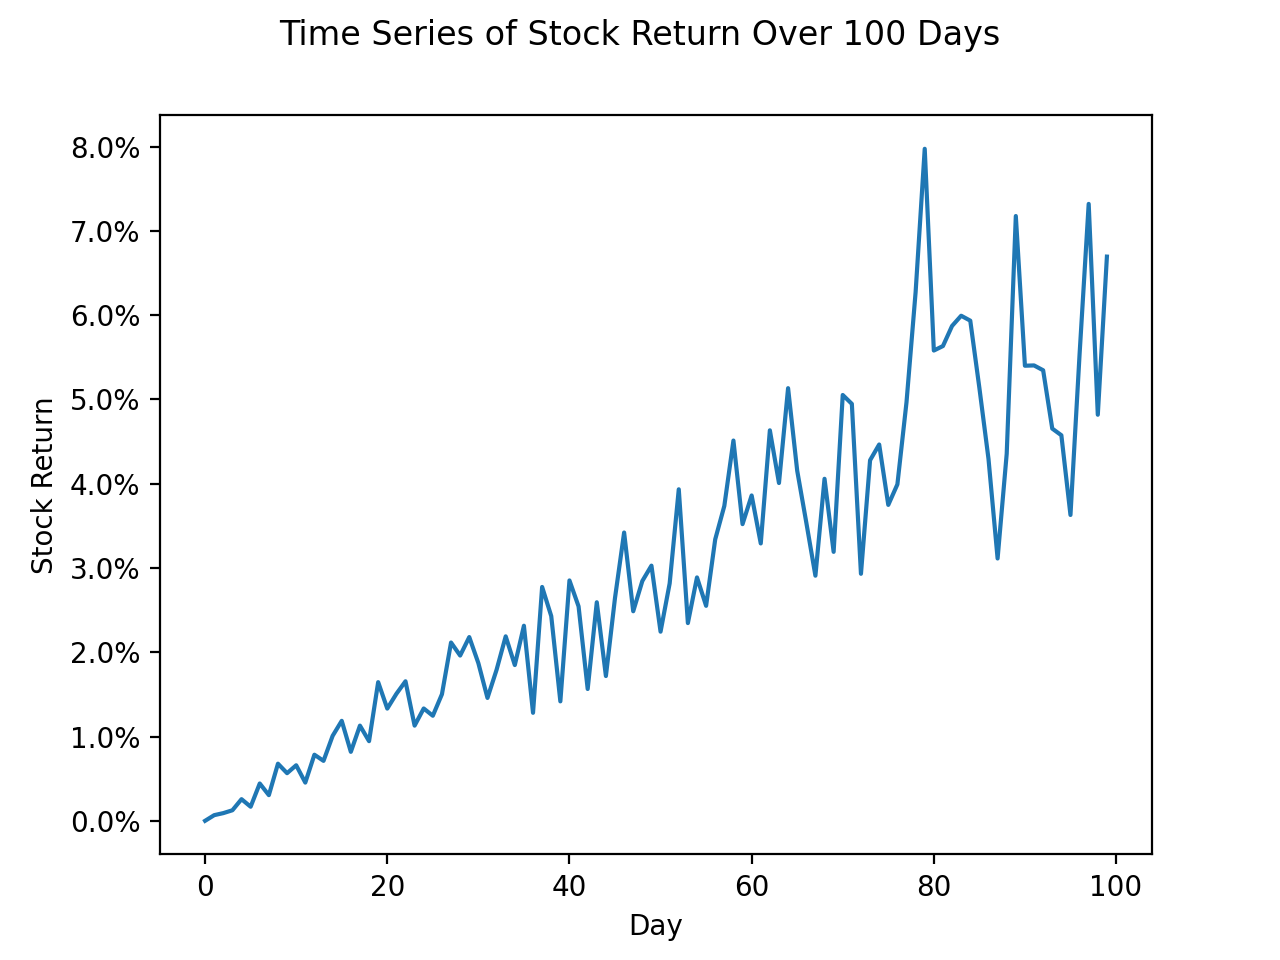
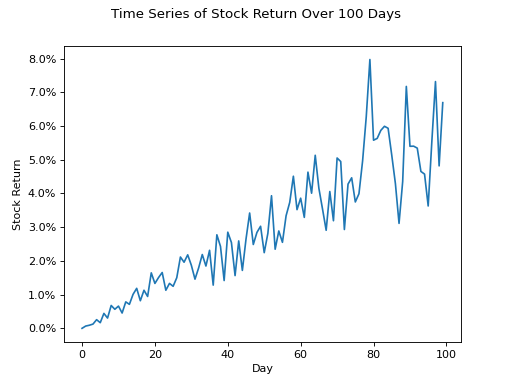
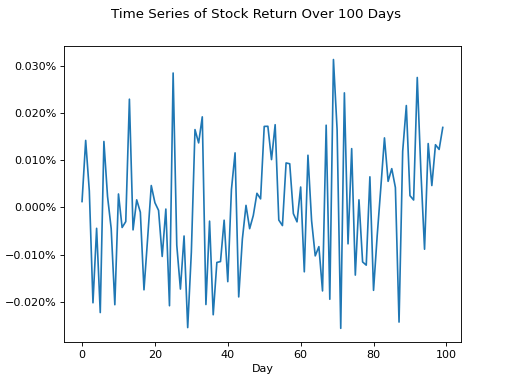
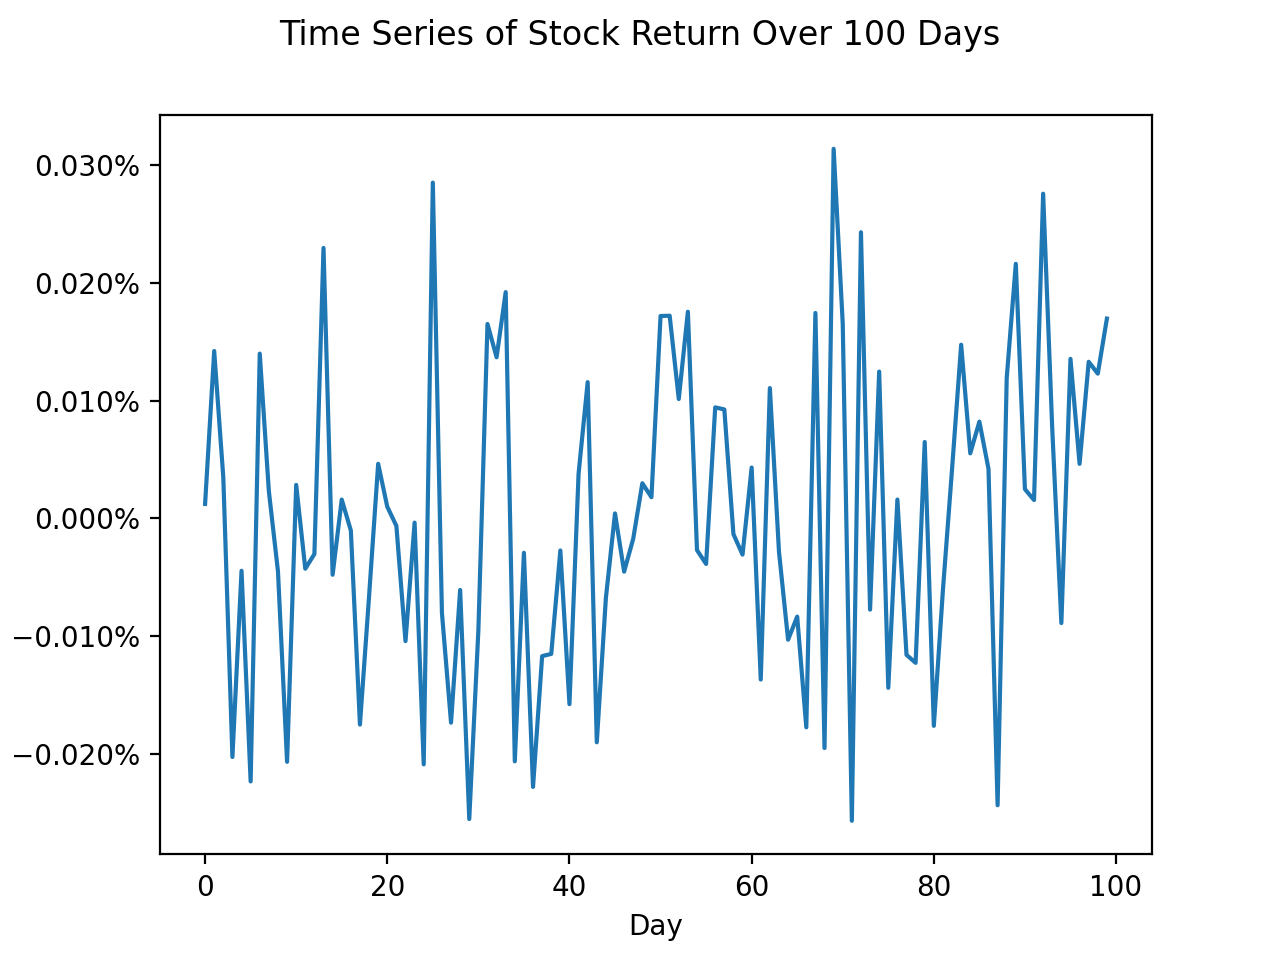
Time Series#
A time series is similar to a scatter plot in almost all ways, except the independent variable in a time series is always a unit of time. A correlation for a time series is called a trend.
Positive Trend#
(Source code, png, hires.png, pdf)
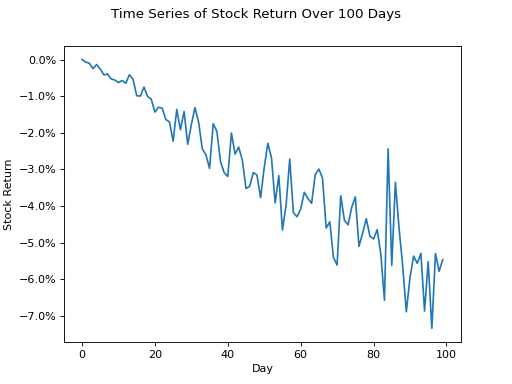
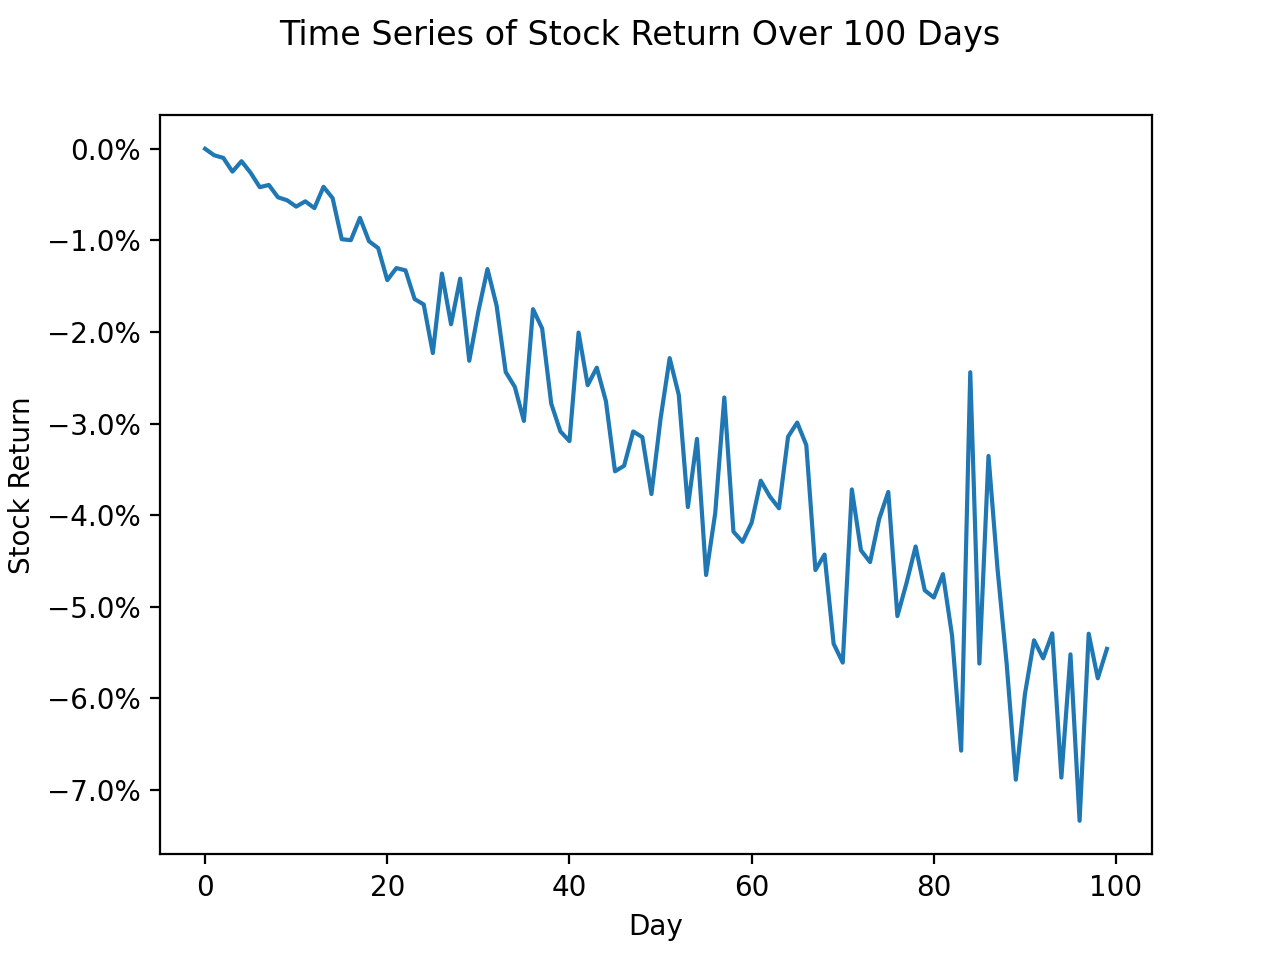
Negative Trend#
(Source code, png, hires.png, pdf)

No Trend#
(Source code, png, hires.png, pdf)
