Statistics: Quarter Two#
Celebration of Knowledge#
2011, Free Response, #3
An apartment building has nine floors and each floor has four apartments. The building owner wants to install new carpeting in eight apartments to see how well it wears before she decides whether to replace the carpet in the entire building.
The figure below shows the floors of apartments in the building with their apartment numbers. Only the nine apartments indicated with an asterisk have children in the apartment.
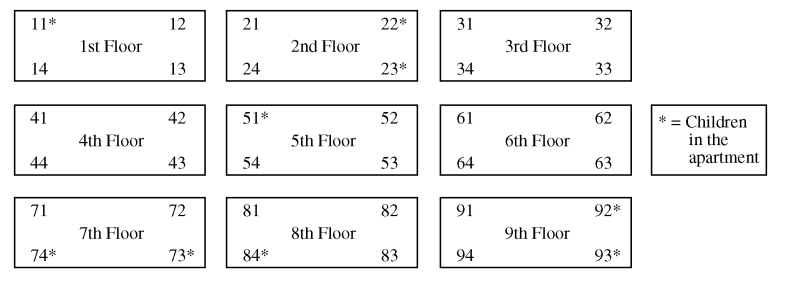
For convenience, the apartment building owner wants to use a cluster sampling method, in which the floors are clusters, to select the eight apartments. Describe a process for randomly selecting eight different apartments using this method.
An alternative sampling method would be to select a stratified random sample of eight apartments, where the strata are apartments with children and apartments with no children. A stratified random sample of size eight might include two randomly selected apartments with children and six randomly selected apartments with no children. In the context of this situation, give one statistical advantage of selecting such a stratified sample as opposed to a cluster sample of eight apartments using the floors as clusters.
2019, Free Response, #2
Researchers are investigating the effectiveness of using a fungus to control the spread of an insect that destroys trees. The researchers will create four different concentrations of fungus mixtures: 0 milliliters per liter (ml/L), 1.25 ml/L, 2.5 ml/L, and 3.75 ml/L. An equal number of the insects will be placed into 20 individual containers. The group of insects in each container will be sprayed with one of the four mixtures, and the researchers will record the number of insects that are still alive in each container one week after spraying.
Identify the treatments, experimental units, and response variable of the experiment.
Does the experiment have a control group? Explain your answer.
Describe how the treatments can be randomly assigned to the experimental units so that each treatment has the same number of units.
2009, Free Response, #3
Before beginning a unit on frog anatomy, a seventh-grade biology teacher gives each of the 24 students in the class a pretest to assess their knowledge of frog anatomy. The teacher wants to compare the effectiveness of an instructional program in which students physically dissect frogs with the effectiveness of a different program in which students use computer software that only simulates the dissection of a frog. After completing one of the two programs, students will be given a posttest to assess their knowledge of frog anatomy. The teacher will then analyze the changes in the test scores (score on posttest minus score on pretest).
Describe a method for assigning the 24 students to two groups of equal size that allows for a statistically valid comparison of the two instructional programs.
Suppose the teacher decided to allow the students in the class to select which instructional program on frog anatomy (physical dissection or computer simulation) they prefer to take, and 11 students choose actual dissection and 13 students choose computer simulation. How might that self-selection process jeopardize a statistically valid comparison of the changes in the test scores (score on posttest minus score on pretest) for the two instructional programs? Provide a specific example to support your answer.
2021, Free Response, #6
Attendance at games for a certain baseball team is being investigated by the team owner. The following boxplots summarize the attendance, measured as average number of attendees per game, for 47 years of the team’s existence. The boxplots include the 30 years of games played in the old stadium and the 17 years played in the new stadium.
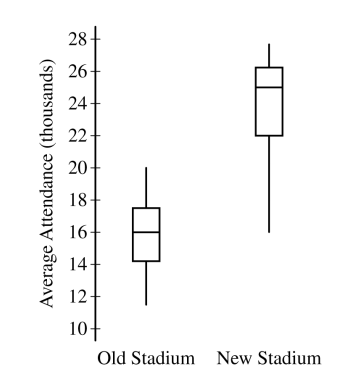
Compare the distributions of average attendance between the old and new stadiums.
The following scatterplot shows average attendance versus year,
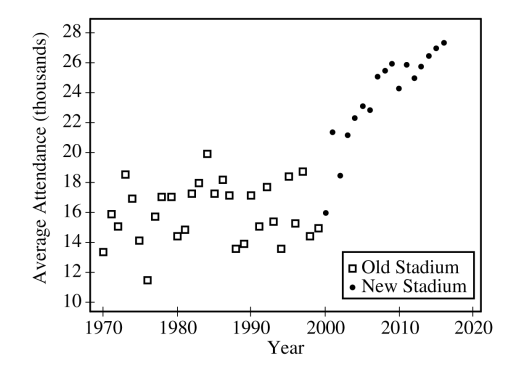
Compare the trends in average attendance over time between the old and new stadium.
Consider the following scatterplots,
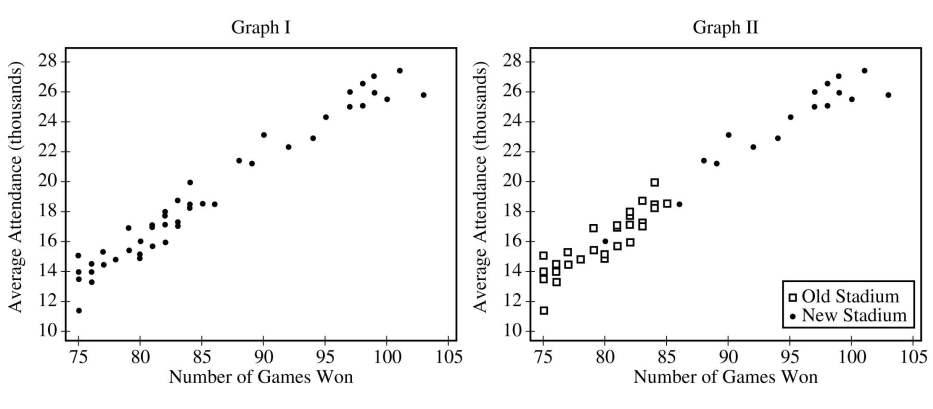
Use this graph to answer the following questions.
Graph I shows the average attendance versus number of games won for each year. Describe the relationship between the variables.
Graph II shows the same information as Graph I, but also indicates the old and new stadiums. Does Graph II suggest that the rate at which attendance changes as number of games won increases is different in the new stadium compared to the old stadium? Explain your reasoning.
Consider the three variables: number of games won, year, and stadium. Based on the graphs, explain how one of those variables could be a confounding variable in the relationship between average attendance and the other variables.
2022, Free Response, #1
A biologist gathered data on the length, in millimeters (mm), and the mass, in grams (g) , for 11 bullfrogs. The data are shown in Plot 1.
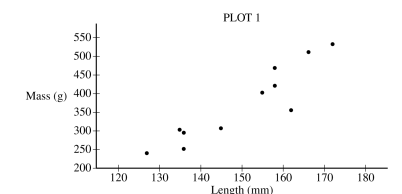
Based on the scatterplot, describe the relationship between mass and length, in context.
From the data, the biologist calculated the least-squares regression line for predicting mass from length. The least-squares regression line is shown in Plot 2 .
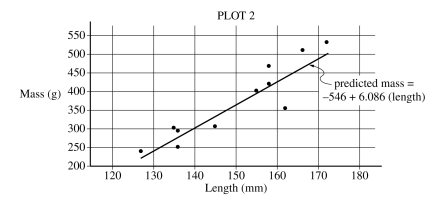
Identify and interpret the slope of the least-squares regression line in context.
Interpret the coefficient of determination of the least-squares regression line,
 , in context.
From Plot 2 , consider the residuals of the 11 bullfrogs.
Based on the plot, approximately what is the length and mass of the bullfrog with the largest absolute value residual?
Does the least-squares regression line overestimate or underestimate the mass of the bullfrog identified in part d-i? Explain your answer.